# Using 3D Viewer Visual
The 3D Viewer Visual was designed to work alongside our Power BI Connector. The data connector will output a table containing the following columns:
- Stream URL 👈
- URL Type
- Commit Object ID🆕 👈
- Object ID 👈
- speckle_type
- data
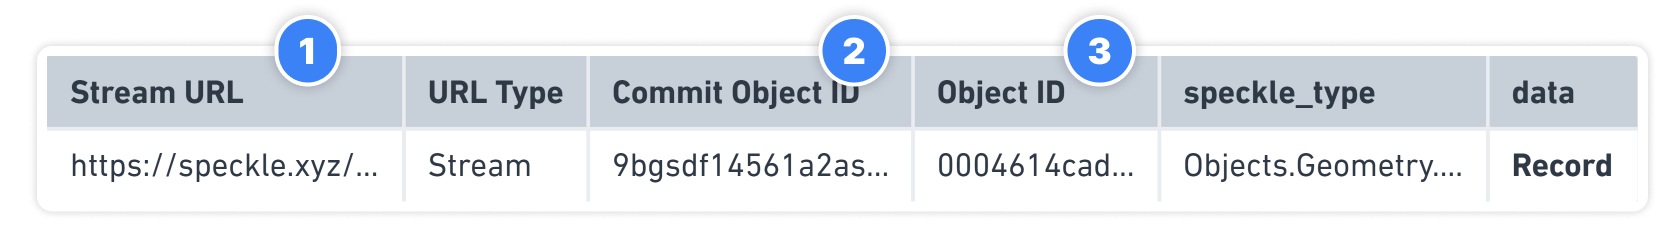
Stream URL, Commit Object ID, and Object ID are used to visualize your Speckle data in 3D.
# Viewing Objects in 3D
With the Speckle 3D Viewer Visual added, you can now configure the input fields to display your Speckle data.
- Drag the "Stream URL" column from your data into the "
Stream URL" input field. - Drag the "Commit Object ID" column from your data into the "
Commit Object ID" input field. - Drag the "Object ID" column from your data into the "
Object ID" input field.
Once all inputs are added, 3D Viewer Visual will load the objects into the scene.
There are two extra optional fields:
Color By: defines how the objects get grouped to be assigned colors.Tooltip data: defines the information shown on the tooltip when selecting an object.
📌IMPORTANT
The Stream URL, Commit Object ID, and Object ID columns will exist on the resulting query when using the Get by URL function.
If you're using the new (experimental) Get by URL [Structured] function, you must generate these columns in your final query table. The information is attached to the table as a META that can be queried in your Query Editor.
# Context-Menu
When an object is right-clicked, the context menu for that object will appear. This allows for easy object exclusion/isolation from the viewer in an interactive way.
If you want to reset the exclusions, click on the 3D Viewer Visual, go to the “Filters” pane, and remove the “Excluded” filters.
📌IMPORTANT
Power BI provides the context menu; some features still need to be implemented in depth. More work will be done to improve context-menu functionality in the coming releases.
← Installation Coloring →